Introduction
This year my parents decided to get solar panels on the roof of their house. The complete system already comes with a monitoring app where you can see statistics about the amount of energy that was produced by the solar cells, how much was used by ourselves and how much is fed back into the grid. While the app already is pretty good at monitoring the solar cells it felt kind of limited in what could be analyzed with this, since there is no way to create custom reports. Also just being able to see the history of energy usage and production is not the same as getting any meaningful insights. Things like calculating the total amount of energy feed back into the grid or calculating how much battery storage one would need to be completely independent of the grid are not possible with the simple monitoring app. That is why I decided to tackle this with a little side project.
Getting the data
Getting access to the data of the monitoring device was harder than expected. Mostly though because there is no documentation about it available anywhere. While the monitoring device provides a website with the current values that could have been read out with an optical character recognition (OCR) tool, in the end, there was a simpler way. The monitoring device has an undocumented subpage that provides us with a JSON file containing the values for current production, usage and the amount fed back to the grid. I wrote a small Python script that logs this information every 5s. The script writes this information into the Postgres database running the timescaledb extension, which is optimized specifically for time-series data.
Update: The undocumented subpage has been deactivated after a software update. The Python script talks directly to the inverter now through a Modbus TCP interface. This means that the commercial monitoring app is not needed for the functionality of this system anymore.
Grafana
Main Dashboard
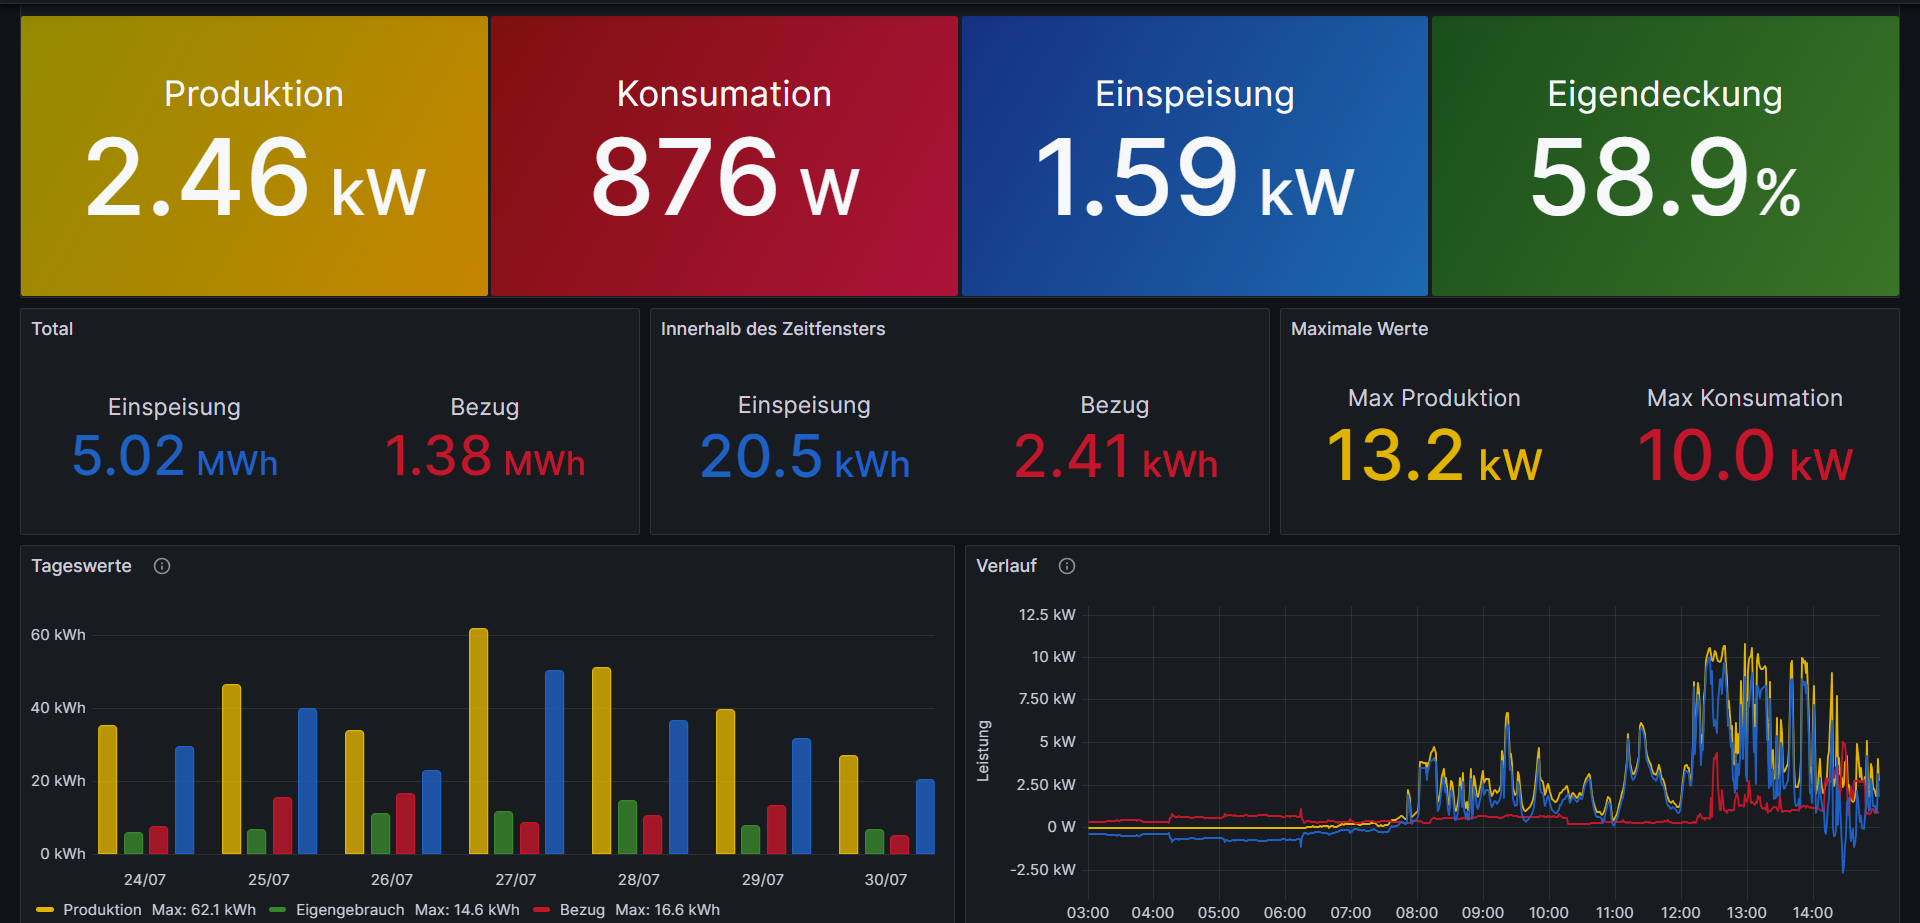
Now that I had the database containing the data from the solar monitoring device, I needed a way to display the data and create useful reports. To do this I decided to use Grafana, an amazing data visualization tool that makes it extremely easy to create beautiful dashboards. It interfaces with the database and uses SQL to select the data used for the different panels in your dashboard. After selecting the needed data, it also allows you to transform the data and finally lets you decide on a type of graph with which the data should be displayed. Ultimately, I created this solar dashboard with all the most important information about the solar cells.
Battery Capacity Calculations
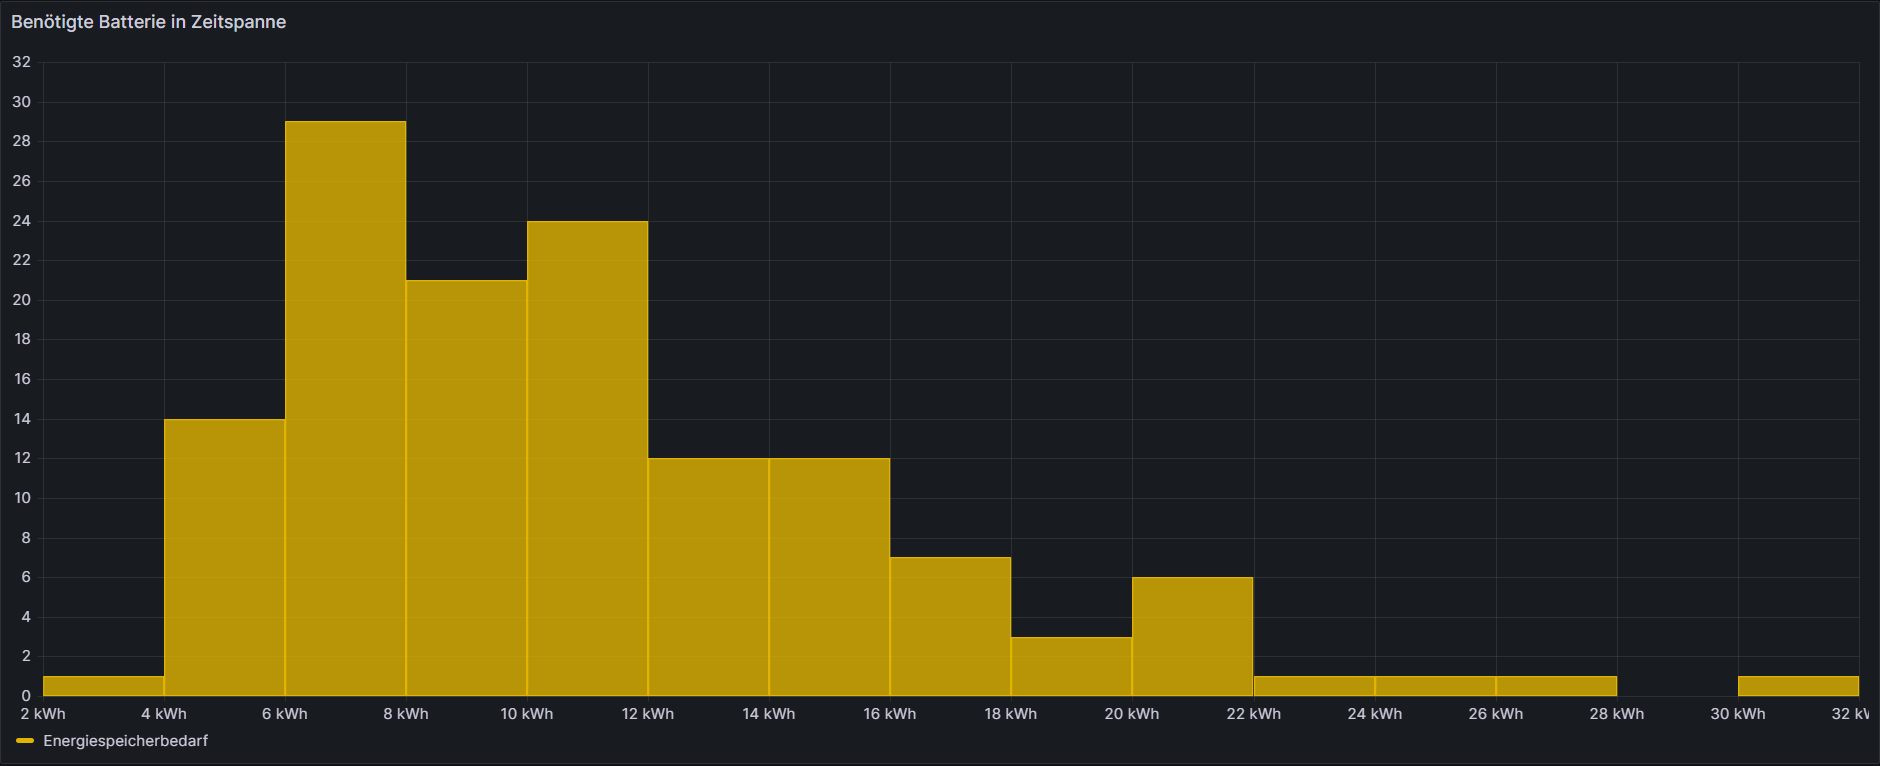
Additionally, since I have access to all the data in the database and can create my own SQL queries and use this to create reports about pretty much anything. I used it, in this case, to support my parents in deciding if it would make sense to buy batteries to store the surplus solar energy and be even more independent from the grid. Since it is hard to know how much capacity one would need I used the data from the solar cells to find out how much energy the batteries would need to store to completely support our house without any energy from the grid. I calculate the maximum capacity needed for every day and plotted it as a histogram. Since batteries are still pretty expensive it might not make sense to spec them out for the maximum amount needed overall but enough to not run out of energy on 80-90% of all days and only rely on the grid for short amounts of time. With this panel and data collected over all four seasons, one can then make an informed decision about how much battery capacity is needed.
Conclusion
While this is just one example of how the data could be used there are many more ways I can use the data to create reports and the good thing is since I log everything into the database I can still create new reports in years to come using the data collected now. It was a fun little project that helped me sharpen my skills with SQL and Databases in general and also allowed me to discover Grafana as an amazing tool for data visualizations that can be used for many more things in future projects.